|
IMPORTANT NOTICE: This web page is for historical reference only. No updates after December 31, 2009.
|

OVERVIEW
Water level:
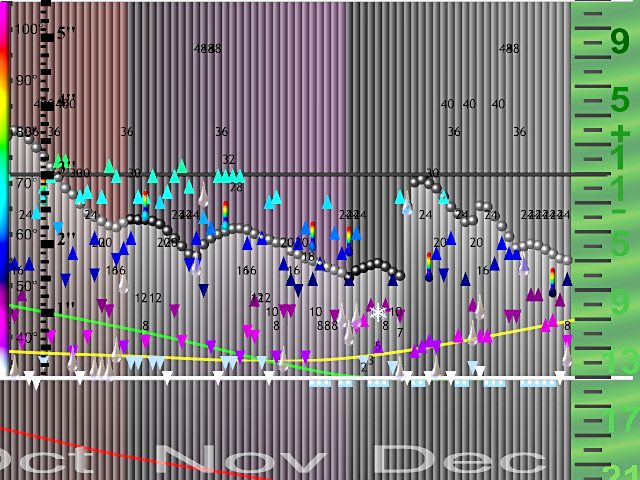
Columns represent days for which a report is recorded. A faded, partial column (without float atop it) is a predicted level some number of days in advance of the current date. Floating balls atop columns are actual levels. The marker lines along both sides of the graph are depth, one foot apart (wider lines every two feet of depth), with numbers zeroed on 510' above mean sea level (summer pool) of each year.
Temperature:
32 to 105 degrees Fahrenheit, constrained within the "winter pool" lines of both current and previous years, 72 degrees is at the summer pool line (approx.). Record-keeping began Jan and Feb 2007 for air and water temps respectively.
Thermometer symbols for water temperature are vertically centered (approx.) so that the red tops can represent the warmest extreme and blue bottoms the coldest extreme, or about a 5 degree range, with the middle part being about where my own temperature readings occur therefore typically warmer water than other places might be, e.g. open waters near the dam and along main branches which are often a few degrees cooler. The colors for the "bulb" of the thermometer represent that reading, with corresponding temperature bar on left side not laterally aligned to bulb, offset lower a couple degrees. This is done to help show a variance due to differing parts of the lake and not a real min/max.
Rainfall:
1/8" at the winter pool line*, 3" at the summer pool line and 5 1/2" at the previous year winter pool line. Record-keeping from Jan 2005 onward, with September and December 2004 "events" of several days each combined, these were Hurricane Ivan and heavy rains respectively.
Dam:
Green, yellow and red curves show upper, average and lower levels of dam operation. Aside from the average, they are "guidelines" not maximum and minimum lake level.
Water release Units (see explanation here) are shown as numerals near the Winter Pool (white) line. These are not intended to be readable as much as their height on the graph are meant to show amount of releases.
Misc:
Low and high water levels are shown using open circles, red/white for low and blue/white for high. Actual record upper level was 521.2' March 1973 and lowest 488.8' October 1971 (a change of 32 feet!), high levels again Mar. 1980 and Feb. 1990.
* less than 1/10" precip. deemed insignificant for lake level changes on this graph

DISCLAIMER
Although this is my own unofficial version it is based on Alabama Power (Smith Dam) water level reports, so at least that part should always be accurate*. Hourly changes can occur but this graph is daily, meaning one specific time each day is represented (usually noon).
However, the temperatures are another matter. I'm using various sources for the air temps (highs/lows) reported for Arley, Alabama, since it's located within the lake area. And water temps are simply those found by some people on the lake, including myself, which won't always be a maximum due to time of day changes. These water temps seem to vary a few degrees from place to place so only an average is used if there are two or more on the same day.
Rainfall totals, or total precipitation, are an averaging of data from NOAA's Weather Service. This must be averaged over the entire lake area, with more emphasis being on the lake itself, including the watershed which drains into it over time. Note that these reports occur the following morning of a 24 hour period and can appear to lag behind sudden water level increases.
About the dam water releases (turbine schedule of Units), those numbers can change throughout the day so what gets recorded here is only a snapshot of each posted schedule, hopefully reflecting actual releases but not at all accurate from my experience in watching them.
You are welcome to use these graphs by linking to this web page or downloading them. Please be aware of these possible inaccuracies when doing so.
*some earlier dates missing
Use the links below for more information about Lewis Smith Lake.
...or... 0mniverse home page
© 2007-2010


